Posts Tagged 'diagram'

diagram: library programs – OMA Proposal

library program

From the OMA Concept Book.

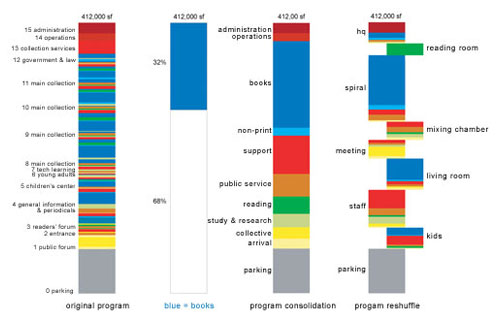
This visualization of the library’s “programs” is the heart of the Library’s design, as confirmed by Joshua Prince-Ramus.

This is the visual slight-of-hand that transposes material books into a “program.” Other programs are: operations, parking, hq, reading, attraction, living room. As groups of functionality and processes, they are very much like computer programs. The metaphor extends to the separation and containment of like programs in five different platforms with “trading floor” areas in between. Again this reveals a database aesthetic rather than a narrative aesthetic — the chart is vertical, not horizontal, not linear, but hierarchical. It is not the linear processes themselves that are depicted but their (database) classification.

The transformation of the original bar of colors, put together by the library’s staff, to OMA’s “program reshuffled” chart very closely resembles the visual feedback of computer disc utility software defragmenting a hard drive. Clearly this is what OMA intends: they have optimized the hard drive that is the Library.

The underlying peculiarity is that the chart gives its programs which, as sets of processes, are not themselves material, a materiality by assigning them square footage. How the program-to-square-footage was formulated is a mystery.
graphic: program diagram

programmatic diagram

This depiction of the library is comprised by a diagrammatic orthogonal cross-section and several differently expressed words reflecting the program, function and elements of the distinct levels of the building. This conceptual tool has various levels of information, not all of which are immediately apparent.

The more self-evident reading relates to the oddly serpentine form of the entire building, generated by the dislocation of the horizontal platforms from the building’s ground footprint.

The second level of information is suggested by the binary system of size and colors of the words that populate the diagram specifically establishing the distinction between areas of compartmentalized flexibility. Thus, areas where there is a high level of certainty of their evolution are specifically designed and enclosed in the floating boxes (represented by the larger and darker words), while other possibly more volatile functions are accommodated on their rooftops (represented by the smaller and lighter words).

Since the future of technology and its impact on the library typology is unclear, uncertainty was equated from the beginning in the design. The introduction of compartmentalized uncertainty, for which flexibility is required, tries to actively engage and manage in physical space the unpredictable change announced by the digital paradigm.